As Head of the Mergers and Acquisitions Team at Astutium much of my day is spent looking at accounts and internal management systems.
One thing that I see a lot, is how the majority of small-business owners in the tech space don’t know (and sometimes don’t know how to calculate) their “numbers” – the key metrics and figures that are essential to getting a “big picture” overview of an organisation.

This shouldn’t be surprising – many start their business with a great idea or new technology or a desire to change things, rather than with a detailed business plan and an MBA.
I’ll ignore Turnover, Profit, Income etc as they’re well understood (and generally available from your accounts apps) and focus on the figures that are important when preparing to value/sell/grow a company.
Knowing where you are is the 1st step in getting where you want to go 🙂
Alice – Would you tell me, please, which way I ought to go from here?
Cheshire Cat – That depends a good deal on where you want to get to.
Alice – I don’t much care where.
The Cheshire Cat – Then it doesn’t matter which way you go.
― Lewis Carroll, Alice in Wonderland
see this quote on youtube
Having the Key Metrics to hand removes the guess-work and (often wildly incorrect) assumptions about the state, growth and position of the business. Just asking a business owner what their ARPU, Gross margin, LTV or Churn rates are regularly gets me blank looks (I tried this on a small group at HostingCon last year and 7/10 didn’t know they could use their billing-system database to calculate an LTV !)
This short series of articles will help you get to the real numbers you need. Afterall there is no point spending £10,000 on adverts (investment) to get £100 clients (1% acquisition rate) if those users only spend a total of £50 (life time value) – unless you’re specifically looking to prop-up an advertising agency 😉
Ask any business owner what they want, the answer is usually one of
- more customers
- more sales
- more profit
or similar.
As high-level goals they’re all great, but a little too vague, and often inter-related – it always pays to be as specific as possible when setting goals/targets 🙂
For example:
You can get more customers by having more Leads, higher Conversions and better Targeting
You can have more sales by increasing Repeat Business (and having more customers)
You can make more profit by increasing your Gross Margin and your ARPU (and having more sales)
You can take more time off by Automating/Systemising, Training good Staff, Delegating
etc
They can all build on each other to help grow your business and thus achieve your goals – a small change in Leads / Conversions / Retentions can have big impacts on your results.
If you’ve not yet read Brad Sugars excellent book Instant Cashflow  I highly recommend picking up a copy.
Let’s start with some key definitions and next week we’ll get into what they are, how you measure them and why they’re so important to your success…
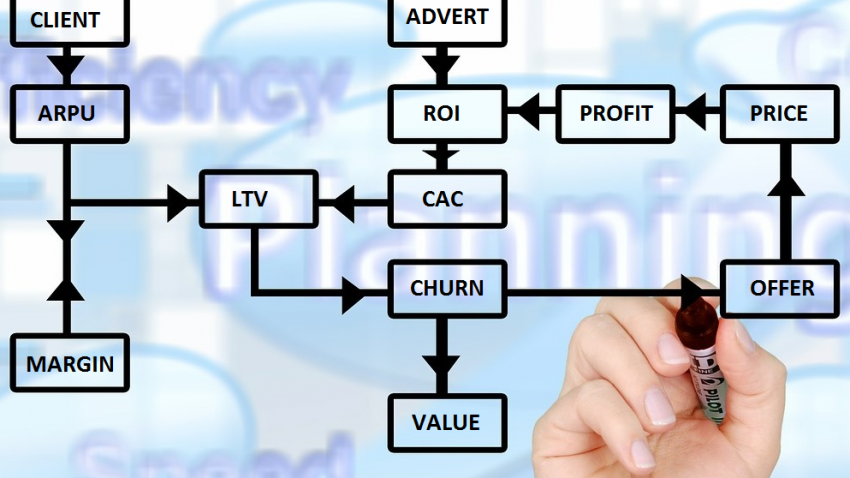
| ARPU | = Average Revenue Per User (per month) |
|---|
|
This is how much (on average) each user of your product/service pays you per month
|
| LTV | = LifeTime Value (per client) |
|---|
|
This is how much (on average) each user of your product/service pays during their lifetime of doing business with you
|
| ARPM | = Average Revenue Per Month |
|---|
|
This is how much (on average) you have coming in (financially) per month
|
| COA | = Cost Of Acquisition |
|---|
|
This is the amount (on average) it costs you to acquire a new customer
|
| CHURN | = Ratio of Clients Leaving |
|---|
|
This is the %age of clients who leave / cancel / abandon your service each month.
Either through your action (termination for non-payment), client action (requesting cancellation/refund) or non-action (simply not renewing)
|


 Early Bird (discounted price) Attendee Tickets Now On Sale for HostingCon Global 2016 (New Orleans).


